


Share on
Merchants often start with a seemingly simple metric: Payment Success Rate. If Provider A reports 90% and Provider B reports 85%, it may seem natural to conclude that Provider A performs better.
However, the comparison may not be that straightforward.
Payment success rates are only directly comparable when they are measured consistently and based on similar transactions processed under similar conditions. Differences in measurement methodology, transaction mix, risk strategies, and routing logic can all materially affect the result.
This means a provider with a higher reported success rate may not necessarily be delivering better payment performance. It may simply be measuring success differently or processing a more favorable mix of transactions.
Before making routing or provider decisions based on payment success rates, merchants should ask these five questions.
1. Are We Measuring Payment Success Rate the Same Way?
Payment success rate may sound like a standardized metric, but its definition can vary across merchants and providers.
Differences may arise from the unit of measurement (e.g. order level vs. payment-request level), the starting point of measurement (e.g. checkout entry vs. payment initiation), and the provider's scope of responsibility (e.g. hosted checkout vs. API-only processing).
The first question to ask is therefore simple: Are the numerator and denominator defined consistently?
Example: Order-Level vs. Payment-Request-Level Success Rate
Consider 100 customers purchasing airline tickets. Ninety pay successfully on their first attempt. The remaining 10 initially fail due to insufficient funds but eventually succeed after three payment attempts in total.
Ultimately, all 100 customers complete their purchases.
At the order level:
100 successful orders ÷ 100 orders = 100%
At the payment-request level, every attempt is counted. The 90 customers who succeed immediately generate 90 requests, while the remaining 10 generate three requests each:
100 successful requests ÷ 120 payment requests = 83.3%
The customer outcome is identical, but the reported success rate differs significantly.
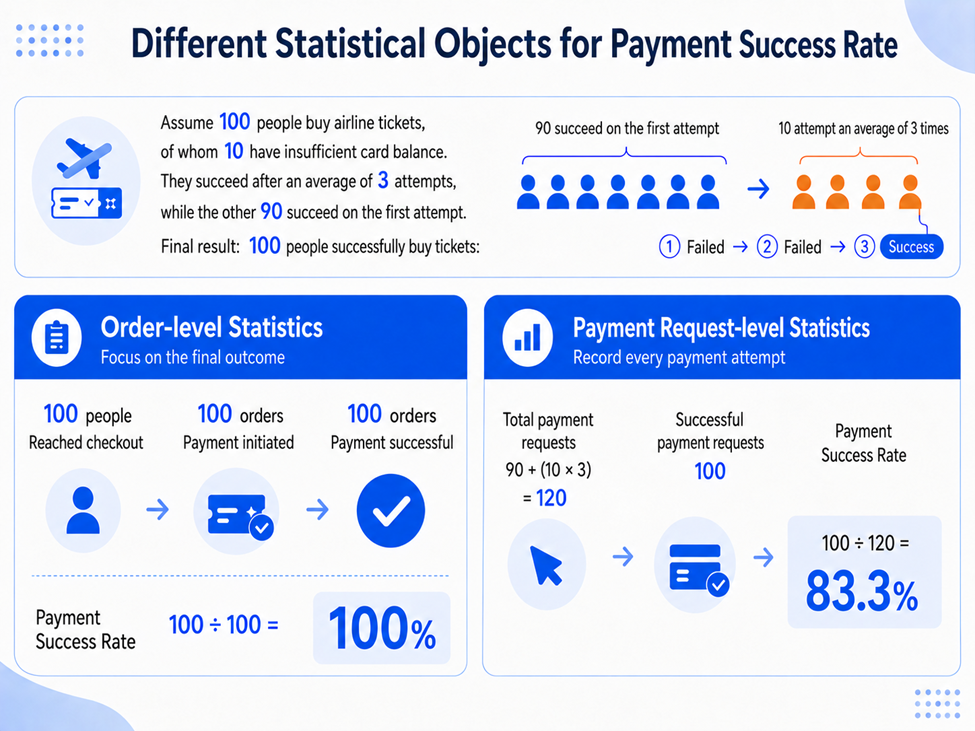
Before comparing providers, make sure the numerator, denominator, and unit of measurement are consistent. Otherwise, an apparent performance gap may simply be a measurement gap.
2. Are We Comparing the Same Transaction Mix?
Transaction mix refers to the composition of transactions processed by a payment service provider, including factors such as payment methods, markets, issuers, customer profiles, and transaction values.
Even when providers calculate success rates in the same way, the transactions they process may be very different.
Payment performance can vary significantly depending on factors such as:
- Payment method: Cards and digital wallets can follow different payment and authentication flows.
- Market and issuer: Authorization behavior can vary across countries, issuers, and domestic versus cross-border transactions.
- Customer profile: New and returning customers may have different payment and risk profiles.
- Transaction value: Higher-value transactions may be treated differently by merchants, risk systems, or issuers.
Consider two providers with success rates of 90% and 85%. If the first provider processes mostly domestic, returning-customer transactions while the second receives more cross-border or higher-risk traffic, comparing their overall success rates does not tell you which provider would perform better on the same transactions.
Where possible, merchants should compare performance across consistent segments — such as the same market, issuer, payment method, or transaction profile — rather than relying only on an aggregate success rate.
3. Are Transactions Being Processed Under the Same Conditions?
Comparable traffic alone is not enough. The same transactions can produce different outcomes if they are processed under different risk and authentication strategies.
For example, one provider may receive transactions subject to mandatory 3DS, while another receives traffic under a dynamic authentication strategy. Similarly, different fraud rules or risk thresholds can determine which transactions are allowed to proceed to authorization.
These differences can affect both the transactions reaching the provider and their eventual payment outcomes.
When benchmarking providers, merchants should therefore check whether fraud controls, authentication strategies, and other relevant processing conditions are aligned.
Otherwise, the comparison may reflect differences in how transactions are treated rather than differences in provider performance.
4. Is Traffic Being Allocated Fairly Between Providers?
How transactions are routed can be just as important as the transactions themselves.
Smart routing may intentionally send transactions from particular issuers, BINs, or markets, as well as specific transaction types, to the provider expected to perform best for them. Once this happens, each provider receives a different traffic mix.
Imagine a routing model has learned that Provider A performs particularly well for certain BINs and begins directing more of those transactions to Provider A. Provider A may subsequently report a higher overall success rate — partly because the routing model is selectively sending it traffic on which it is already expected to perform well.
Its higher success rate therefore does not necessarily mean it would outperform Provider B across all comparable transactions.
Create a Fair Benchmark
The most reliable comparison is a controlled A/B test, where comparable transactions are randomly allocated across providers during the same period.
For merchants using smart or dynamic routing, fully randomizing production traffic may not be practical. Instead, merchants can consider setting aside hold-out groups where transactions are randomly allocated across providers, while the remaining traffic continues to follow the existing dynamic routing strategy.
Performance within the hold-out groups provide a cleaner benchmark for comparing providers and helps separate underlying provider performance from differences due to routing bias.
5. What Is Actually Driving the Remaining Performance Gap?
Once measurement, transaction mix, processing conditions, and traffic allocation have been aligned, a performance difference may still remain.
The next question is: Why?
Some declines are driven primarily by factors outside a provider's control, such as insufficient funds, lost or frozen cards, or certain issuer restrictions. If one provider receives more of these transactions, its overall success rate may naturally be lower without necessarily indicating weaker processing performance.
Other declines may offer greater scope for optimization through authentication strategy, credential quality, transaction messaging, routing, or issuer connectivity.
Understanding the difference requires visibility into the underlying decline reasons.
Providers may map issuer or network response codes into different internal categories, so comparing provider-level decline reports alone can be misleading. Where available, merchants should examine original network or issuer response codes alongside provider-normalized decline categories.
This can help determine whether a performance gap is primarily driven by transaction quality and issuer behavior, or whether there are areas where payment optimization may improve outcomes.
To learn more about why issuers decline payments and how decline codes can reveal optimization opportunities, read Antom's Decoding the Cross-Border Payment Black Box: What Issuers Are Really Telling You
You can also explore Boost Order Conversion by Reducing Avoidable Card Declines
Fair Comparisons Lead to Better Payment Decisions
A higher payment success rate does not necessarily mean better provider performance. Before drawing conclusions, merchants should ask:
- Are we measuring the same thing?
- Are we comparing the same transaction mix?
- Are transactions being processed under the same conditions?
- Is traffic being allocated fairly?
- What is actually driving the remaining gap?
Answering these questions helps merchants separate genuine provider-performance differences from differences caused by measurement, traffic composition, processing strategies, and routing.
The result is a more reliable view of payment performance — and better-informed routing and provider decisions.
Antom helps merchants analyze payment performance across key dimensions, including payment methods, markets, issuers, transaction values, and decline reasons, to understand what is driving performance and identify opportunities for optimization.
Talk to an Antom payment expert to better understand your payment performance and uncover opportunities to improve payment success rates.